The Computer Performance Shell Game
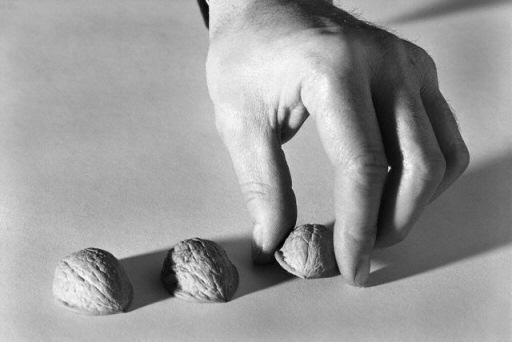
The performance of any computer is akin to a shell game.
The computer performance shell game, also known as “find the bottleneck,” is always played between these four resources:
- CPU
- Disk
- Network
- Memory
At any given moment, your computer is waiting for some operation to complete on one of these resources. But which one: CPU, memory, disk, or network? If you’re interested in performance, the absolute first thing you have to do is determine which of these bottlenecks is currently impeding performance – and eliminate it. At which point the bottleneck often shifts to some other part of the system, far too rapidly for your eye to see. Just like a real shell game.
So the art of performance monitoring is, first and foremost, getting your computer to tell you what’s going on in each of these areas – so you can make your best guess where the pea is right now.
My previous performance drug of choice was Task Manager, or its vastly more sophisticated bigger brother, Process Explorer. But now that I’ve discovered the Reliability and Performance Monitor, I can’t stop watching it. It is my crystal meth. While the previous tools were solid enough, they both had one glaring flaw. They only showed CPU load and memory usage. Those are frequently performance bottlenecks, to be sure, but they’re only part of the story.
The Reliability and Performance Monitoring tool, while continuing the fine Microsoft product tradition of absolutely freaking horrible names, is new to Windows Vista and Windows Server 2008. And it rocks.
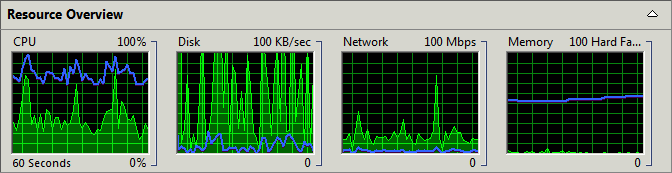
Right off the bat you get a nice summary of what’s going on in your computer performance shell game, with an overview graph and high water marks for CPU, Disk, Network, and Memory, along with scaled numbers. Eyeball this one key set of graphs and you can usually get a pretty good idea which part of your computer is working overtime.
There are also collapsible detail sections for each graph. On these detail sections, bear in mind the numbers are all live, and the default sort orders tend to bring the most active things to the top. And they stay at the top until they’re no longer using that resource, at which point they disappear. The detail sections are a quick way to drill down into each resource and see what programs and processes are monopolizing it at any given time.
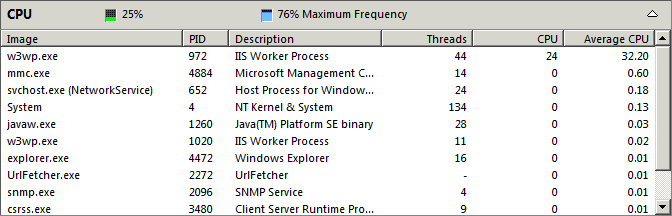
The CPU detail section gives you a moving average of CPU usage, which is much saner than Task Manager’s always shifting numbers. Admittedly, this section isn’t radically different than taskman – and it’s functionally identical to the Unix top command. But the moving average alone is surprisingly helpful in avoiding obsessing over rapid peaks and valleys.
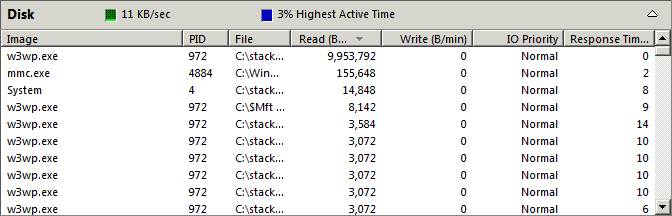
The Disk detail section shows which processes are reading and writing to disk, for what filenames/paths, and how long it’s taking to service those requests – in real time. I generally alternate between read and write sort order here, although sometimes response time can be informative as well.
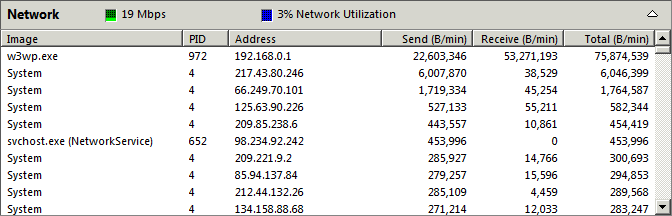
The Network detail section shows which processes are sending the most data over the network right now. On a public website, this gives you an at-a-glance breakdown of which IP addresses are hitting you the hardest. In fact, while checking this, I just laid down another IP ban for some random IP that was scraping the heck out of our site.
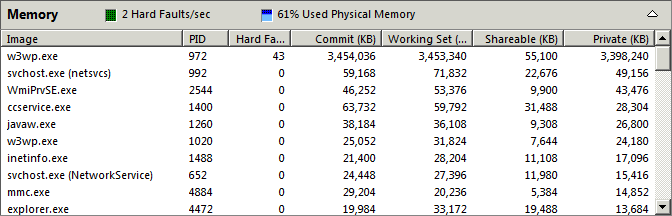
The Memory detail section shows the five most essential metrics for memory usage in real time. Hard Faults are, of course, forced reads from disk into memory – something you want to keep a close eye on. And Working Set is the best general indicator of how much memory a process is actively using to do its thing.
The computer performance shell game is nothing new; it is as old as computing itself. And it is a deeply satisfying game for those of us who love this stuff.
I thought I knew how to play it, until I discovered the Reliability and Performance Monitor. Now that I have a utility like this to let me suss out exactly where that performance pea is, I realize how much I was missing.
Now, on to three card monte. Watch my hands closely!