Perfmon Gone Wild
When diagnosing server performance problems, the first tool I turn to is the humble Task Manager. That’s usually enough to get a rough idea of where we are in the bottleneck shell game: is it CPU, Disk, Network or Memory?
But sometimes you need to dig into performance a little deeper. Then it’s time to drag out Performance Monitor. I always resist doing this for as long as I can because using perfmon is like trying to sip from a fire hose: there are a zillion performance counters that produce veritable mountains of data. The .NET framework has probably a hundred .NET-specific performance counters, and that’s just a tiny fraction of the available operating system performance counters. It’s downright overwhelming. Where to begin?
Microsoft provides a helpful performance monitor wizard which walks you through the process of setting up a perfmon trace with default counters. Per the Wizard, that’s the following:
Cache*
Memory*
Network Interface(*)*
Objects*
Paging File(*)*
Physical Disk(*)*
Process(*)*
Processor(*)*
Redirector*
Server Work Queues(*)*
Server*
System*
Once created, the trace can be stopped, started or modified via the Computer Management / System Tools / Performance Logs and Alerts / Counter Logs interface. Here’s what the default wizard-produced trace looks like:
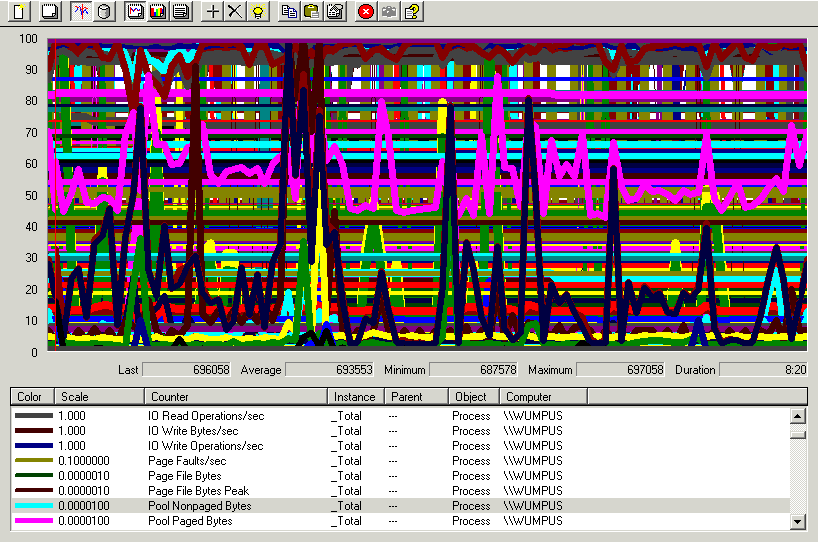
It’s perfmon gone wild!
This is way, way, WAY too much information. Let’s see if we can narrow it down to some key performance counters:
- Processor(_Total)% Processor Time
The percentage of elapsed time that the processor spends to execute a non-Idle thread - Processor(_Total)Interrupts/sec
An indirect indicator of the activity of hardware devices that generate interrupts, such as the system clock, the mouse, disk drivers, data communication lines, network interface cards, and other peripheral devices. - SystemProcessor Queue Length
The number of non-running ready threads in the processor queue. There is a single queue for processor time even on computers with multiple processors. If a computer has multiple processors, you need to divide this value by the number of processors servicing the workload. A sustained processor queue of less than 10 threads per processor is normally acceptable, depending on workload. - MemoryAvailable Bytes
The amount of physical memory, in bytes, available to processes running on the computer. Calculated by adding the amount of space on the Zeroed, Free, and Standby memory lists. - Process(All_processes)Working Set
The set of recently touched memory pages for all processes. If free memory in the computer is above a threshold, pages are left in the Working Set of a process even if they are not in use. When free memory falls below a threshold, pages are trimmed from Working Sets. If they are needed they will then be soft-faulted back into the Working Set before leaving main memory. - MemoryPages/sec
The rate at which pages are read from or written to disk to resolve hard page faults. This is a primary indicator of the kinds of faults that cause system-wide delays. It includes pages retrieved to satisfy faults in the file system cache. - PhysicalDisk% Disk Time
The percentage of elapsed time that the selected disk drive was busy servicing read or write requests. - PhysicalDiskCurrent Disk Queue Length
The number of requests outstanding on the disk at the time the performance data is collected. Requests experience delays proportional to the length of this queue minus the number of spindles on the disks. For good performance, this difference should average less than two. - ServerBytes Received/sec
The number of bytes the server has received from the network. - ServerBytes Transmitted/sec
The number of bytes the server has sent on the network.
Those counters should be enough to give you a general sense of whether you’re dealing with a disk, memory, CPU, or network bottleneck – without being too overwhelming.
If you need to capture more performance counters than this, I suggest switching the counter log to CSV output via the properties dialog. Then download Microsoft’s excellent LogParser tool. Now you can slice, dice, and even graph the data however you like using a relatively simple SQL-like syntax.