Everything you always wanted to know about Task Manager but were afraid to ask
Does anyone remember the Task List from early versions of Windows?
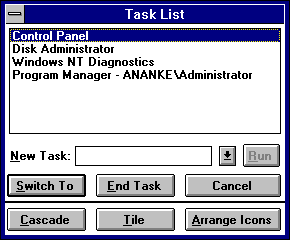
From those humble beginnings comes my all time favorite windows applet, the venerable Task Manager. Task Manager was introduced with Windows NT 4.0, and although it has changed little in the intervening nine years, it hasn’t needed to. Unlike virtually every other Windows OS applet of similar vintage** I still use it every day. That’s a testament to how well Task Manager was originally designed.
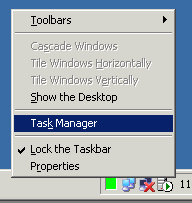
There are a few different ways to launch Task Manager: 12
-
If you’re lazy:
-
If you’re a contortionist:
Shift + Ctrl + Esc
-
If you love modal dialogs:
Ctrl + Alt + Del, then click
 or press the T key.
-
If you’re a ninja keyboard user:
 + R, taskman, Enter
Task Manager has a tabbed interface, and there are a few rules applicable to all tabs:
- Double-clicking the body of the tab area causes the tab to “expand” to cover the entire dialog area. This is particularly useful on the tabs with graphs (Networking and Performance).
- The Options and View menus are tab-sensitive; the menu items change depending on which tab is currently active. Be sure to try these menus with each tab selected to see the various options available.
- If explorer crashes, you can use taskman as a quick and dirty shell to restart your machine or launch a new process. Just use the File | Run and Shut Down menus.*
The Applications tab isn’t a complete list of everything running on your computer, just a list of everything that has a visible main window.
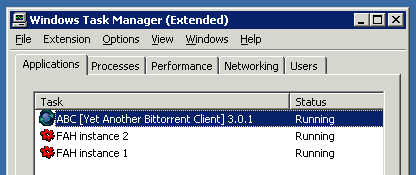
- It’s not obvious, but you can multi-select applications on this tab. Try it! This also works for End Task and Tile/Cascade from the Windows menu.
- Double-click an application to switch to it. You may want to turn off Options | Minimize on Use if you like doing this.
- Don’t forget the right click menu. It’s the most convenient way to interact with the applications in the list.
- Sometimes it’s hard to tell how applications map to processes. Why guess when you can right click the application and select Go To Process? That will take you to the process tab and highlight the correct process.
The Processes tab is a list of everything running on your PC, whether it has a visible window or not. I use this tab all the time to scan for processes using a lot of CPU or memory.
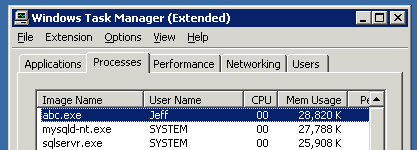
- Drag and drop the columns to re-order them; double-click a column border to auto-size it.
- Sorting column headers is probably the single most powerful function in task manager. You can diagnose almost any performance problem by sorting the right process column!
- The default set of process data columns is extremely spartan. I recommend using the View, Select Columns menu to turn on the optional process information. There are tons more columns to choose from, but these are the most essential for day-to-day use:
- Mem Usage
The “working set” of a process – the amount of memory it is actively using right now to do whatever it is doing. - Peak Mem Usage
The maximum amount of memory this process has ever used since it was running. - Page Faults
The number of times this process has been forced to reload memory pages from the page file. - VM Size
How much of the processes’ less frequently used memory has been paged to disk. - Base Priority
The priority of this process. Low and Normal are standard; anything with a higher priority than that is quite unusual and should be reserved for system processes. Note that taskman itself runs at High priority by default.
- Mem Usage
- Judicious use of right-click, Set Priority on a CPU or I/O intensive process can work wonders to make your machine more responsive. Reducing priority is fairly safe. However, I would avoid increasing priority unless you have an extremely compelling reason to do so.
- If you have a dual core or dual CPU system, using right-click, Set Affinity can help performance by binding a CPU-intensive process to a specific processor. That’s how you avoid the “each processor is at 50% load” phenomenon. Some tasks can benefit slightly when they are stuck to a particular CPU.
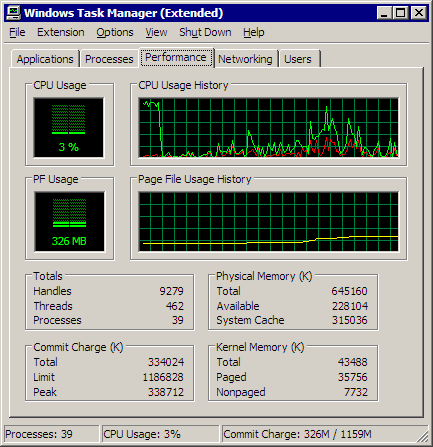
The Performance tab is the ultimate “dashboard” tab. If you know what to look for, this tab can tell you everything you need to know about the health of your PC.
-
CPU usage

CPU usage is the one graph that doesn’t need a lot of explanation. It will show one graph per CPU, so it’s a good way of verifying that your multiple CPU system is load sharing appropriately. You can also add a red kernel time line to the CPU graphs via the View, Kernel Time menu. That’s a measure of how much time the CPU is spending servicing low-level driver requests (e.g., busywork) instead of running code.
-
Page File usage

Apps tend to request a lot of memory – more than they use at any given time. The OS will trim the less frequently used memory by writing it to disk in the page file. Page file usage is typically not a concern except in extraordinary cases; it’s the commit charge you have to worry about.
-
Totals

A count of all the resources in use on your PC: processes, threads, and handles. Not terribly helpful; it’s better to drill down on this data via the processes tab.
-
Physical Memory

System Cache tells you how much memory is being used as a disk cache, e.g., to avoid accessing the physical hard drive. There’s a delicate balance between System Cache and Available Physical Memory. You want a reasonable amount of free memory, but free memory is also wasted memory – it should be utilized as disk cache whenever possible.
-
Commit Charge

Commit charge is the single most important section of the performance tab. It’s the total amount of memory in use by all applications, including memory that has been temporarily paged to disk. If the peak commit charge is greater than the physical memory in your PC, your PC is running out of memory and thrashing. If it happens rarely, you’re OK, but if it’s a frequent occurrence, it’s time to get a memory upgrade. And god forbid you ever reach the commit charge limit. I guess then it’s time to upgrade to a 64-bit OS.
-
Kernel Memory

Every application has a certain amount of OS housekeeping overhead. Most of it can be paged to disk if necessary, but some has to be in memory at all time. These numbers are basically trivia since they’re so small relative to the 512MB or 1GB of memory in a modern PC.
The Networking tab is the newest addition to Task Manager, but it’s also the most disappointing.
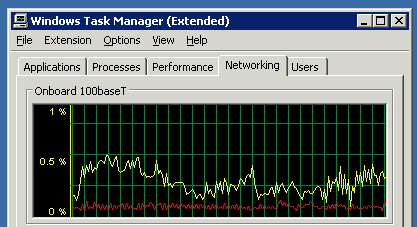
- By default you’ll see total bytes (green). You can break out bytes received (yellow) and bytes sent (red) via the View, Network Adapter History menu.
- The graph is always displayed as a percentage of network utilization, which I find incredibly annoying. I wish there was a simpler graph that showed bytes or kilobytes on the axis instead of percent utilization. We can’t change the graph, but we can use the View, Select Columns menu to turn on the optional columns Bytes Sent Per Interval and Bytes Received Per Interval.

Divide by 1024 and we’ve got kilobytes per second throughput for that network card.
Yeah, there are better task management applications, but you have to admit – for a nine year old bundled application, ye olde Task Manager is pretty kickass. I took a quick look at Task Manager in the latest pre-beta 2 build of Windows Vista from PDC 2005, and I didn’t see any obvious differences. Here’s to another 9 years of glorious Task Management!
*The “Shut Down” menu is not shown on the Task Manager window when accessing machines over Remote Desktop. However, you can shut down machines remotely using Ctrl+Alt+End to bring up the Windows Security dialog which has a Shut Down button.
**Charmap or WordPad, anyone? I didn’t think so.


