Suffering as a Feature

Have you seen this?
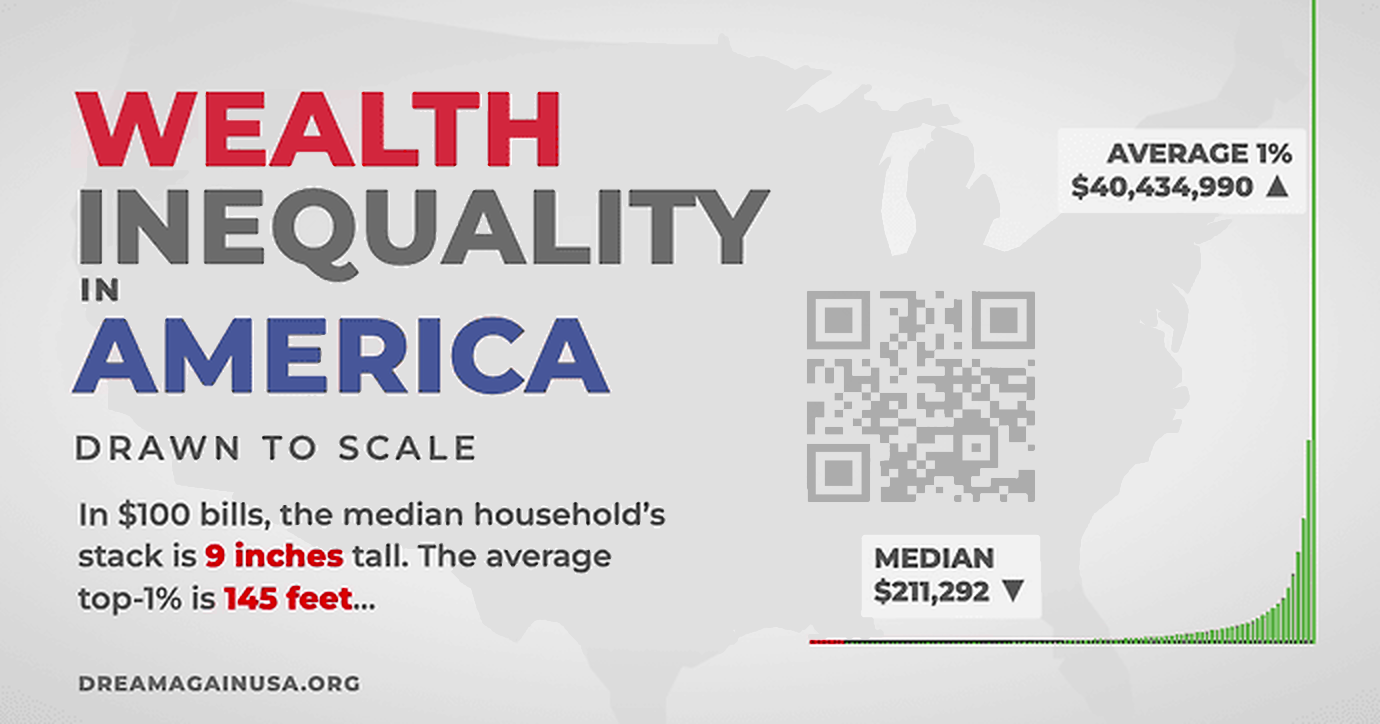
If you haven't, you should. I think everyone needs to. Wealth inequality on a scale this extreme is almost impossible to explain. You have to experience it to understand.
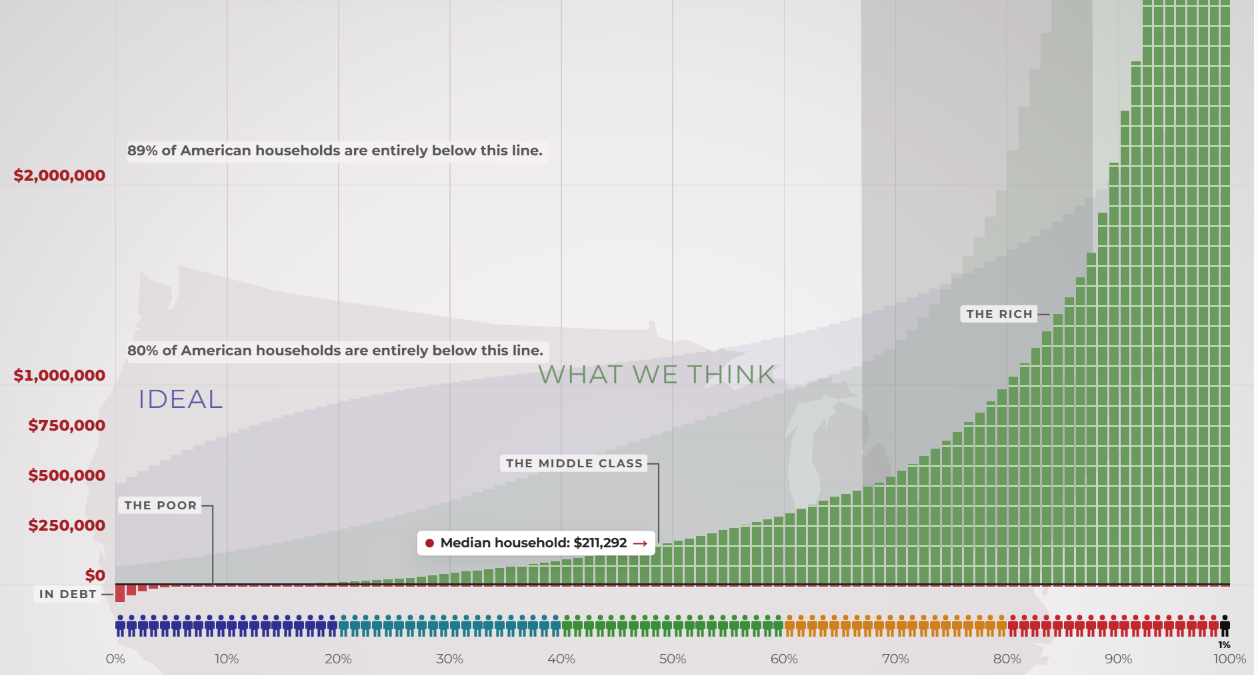
Go ahead. Try it out.
Where is the top of this graph? Good question. Keep scrolling up. Last time I did this it took me 12 minutes and 51 seconds, but the whole time I had a way out.

We get a button on the screen that lets us punch out any time we want: I quit. But do other Americans get an easy way out of the most extreme wealth concentration in history, piled up together all the way down there at the bottom of this graph?
No. They don't.
That's why we built this website. That's why I supported the updated 2026 wealth inequality video series, because 14 years ago, the original video changed how I thought about the world. I watched it again and again, year after year, because it shows something we feel, but rarely see so clearly — the obscene concentration of wealth and power in this country.
People deserve to see the facts plainly, visually, with sources and methodology attached. Politizane, The Onion and Garbage Day retained full control over their work. I did not tell anyone what to make, what to say, or how to say it. I told everyone involved the same thing I'm telling you right now – this is not for me, or any organization. It is for the public. It is for We, The People.
I used to be very dismissive of so-called "walking simulators", games where no real choice is offered, it's just an experience. But this graph isn't a game – these are people's actual lives. No one is forcing you to visit this website, no one is making you scroll up endlessly. The experience, then, is about endurance in the face of the relentless task of simply living your daily life with almost nothing, surviving as long as you can without reaching for the "I Quit" button. That's the experience the vast majority of Americans are having. It is harrowing.
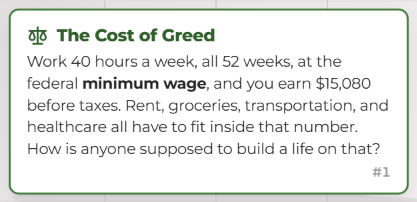
As we built the website (Geoff Dalgas, my friend who helped me build Stack Overflow, did all the technical work) and tested it, as I obsessively scrolled upwards so many times, I slowly realized the whole thing is supposed to be inconvenient. The further you climb on this vast scale, the longer this seemingly endless scrolling goes on, the more the reality sinks in... how obscene all of it is. In order to understand the suffering of others, you must be willing to endure and suffer a little bit yourself. In this case, suffering is a feature.
Early iterations of the website had automatic scrolling, or rapid jumps, but I felt that wasn't right and should not be allowed. You need to do the work, make a physical action to scroll the entire way. We even stop you from scrolling at certain milestones.
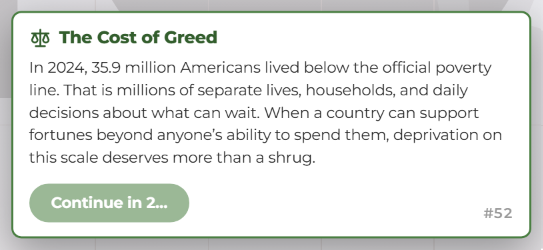
This is a forced stop because no one should blindly scroll past 36 million Americans living in poverty, while at the same time we could eliminate all poverty in this country for $177 billion.
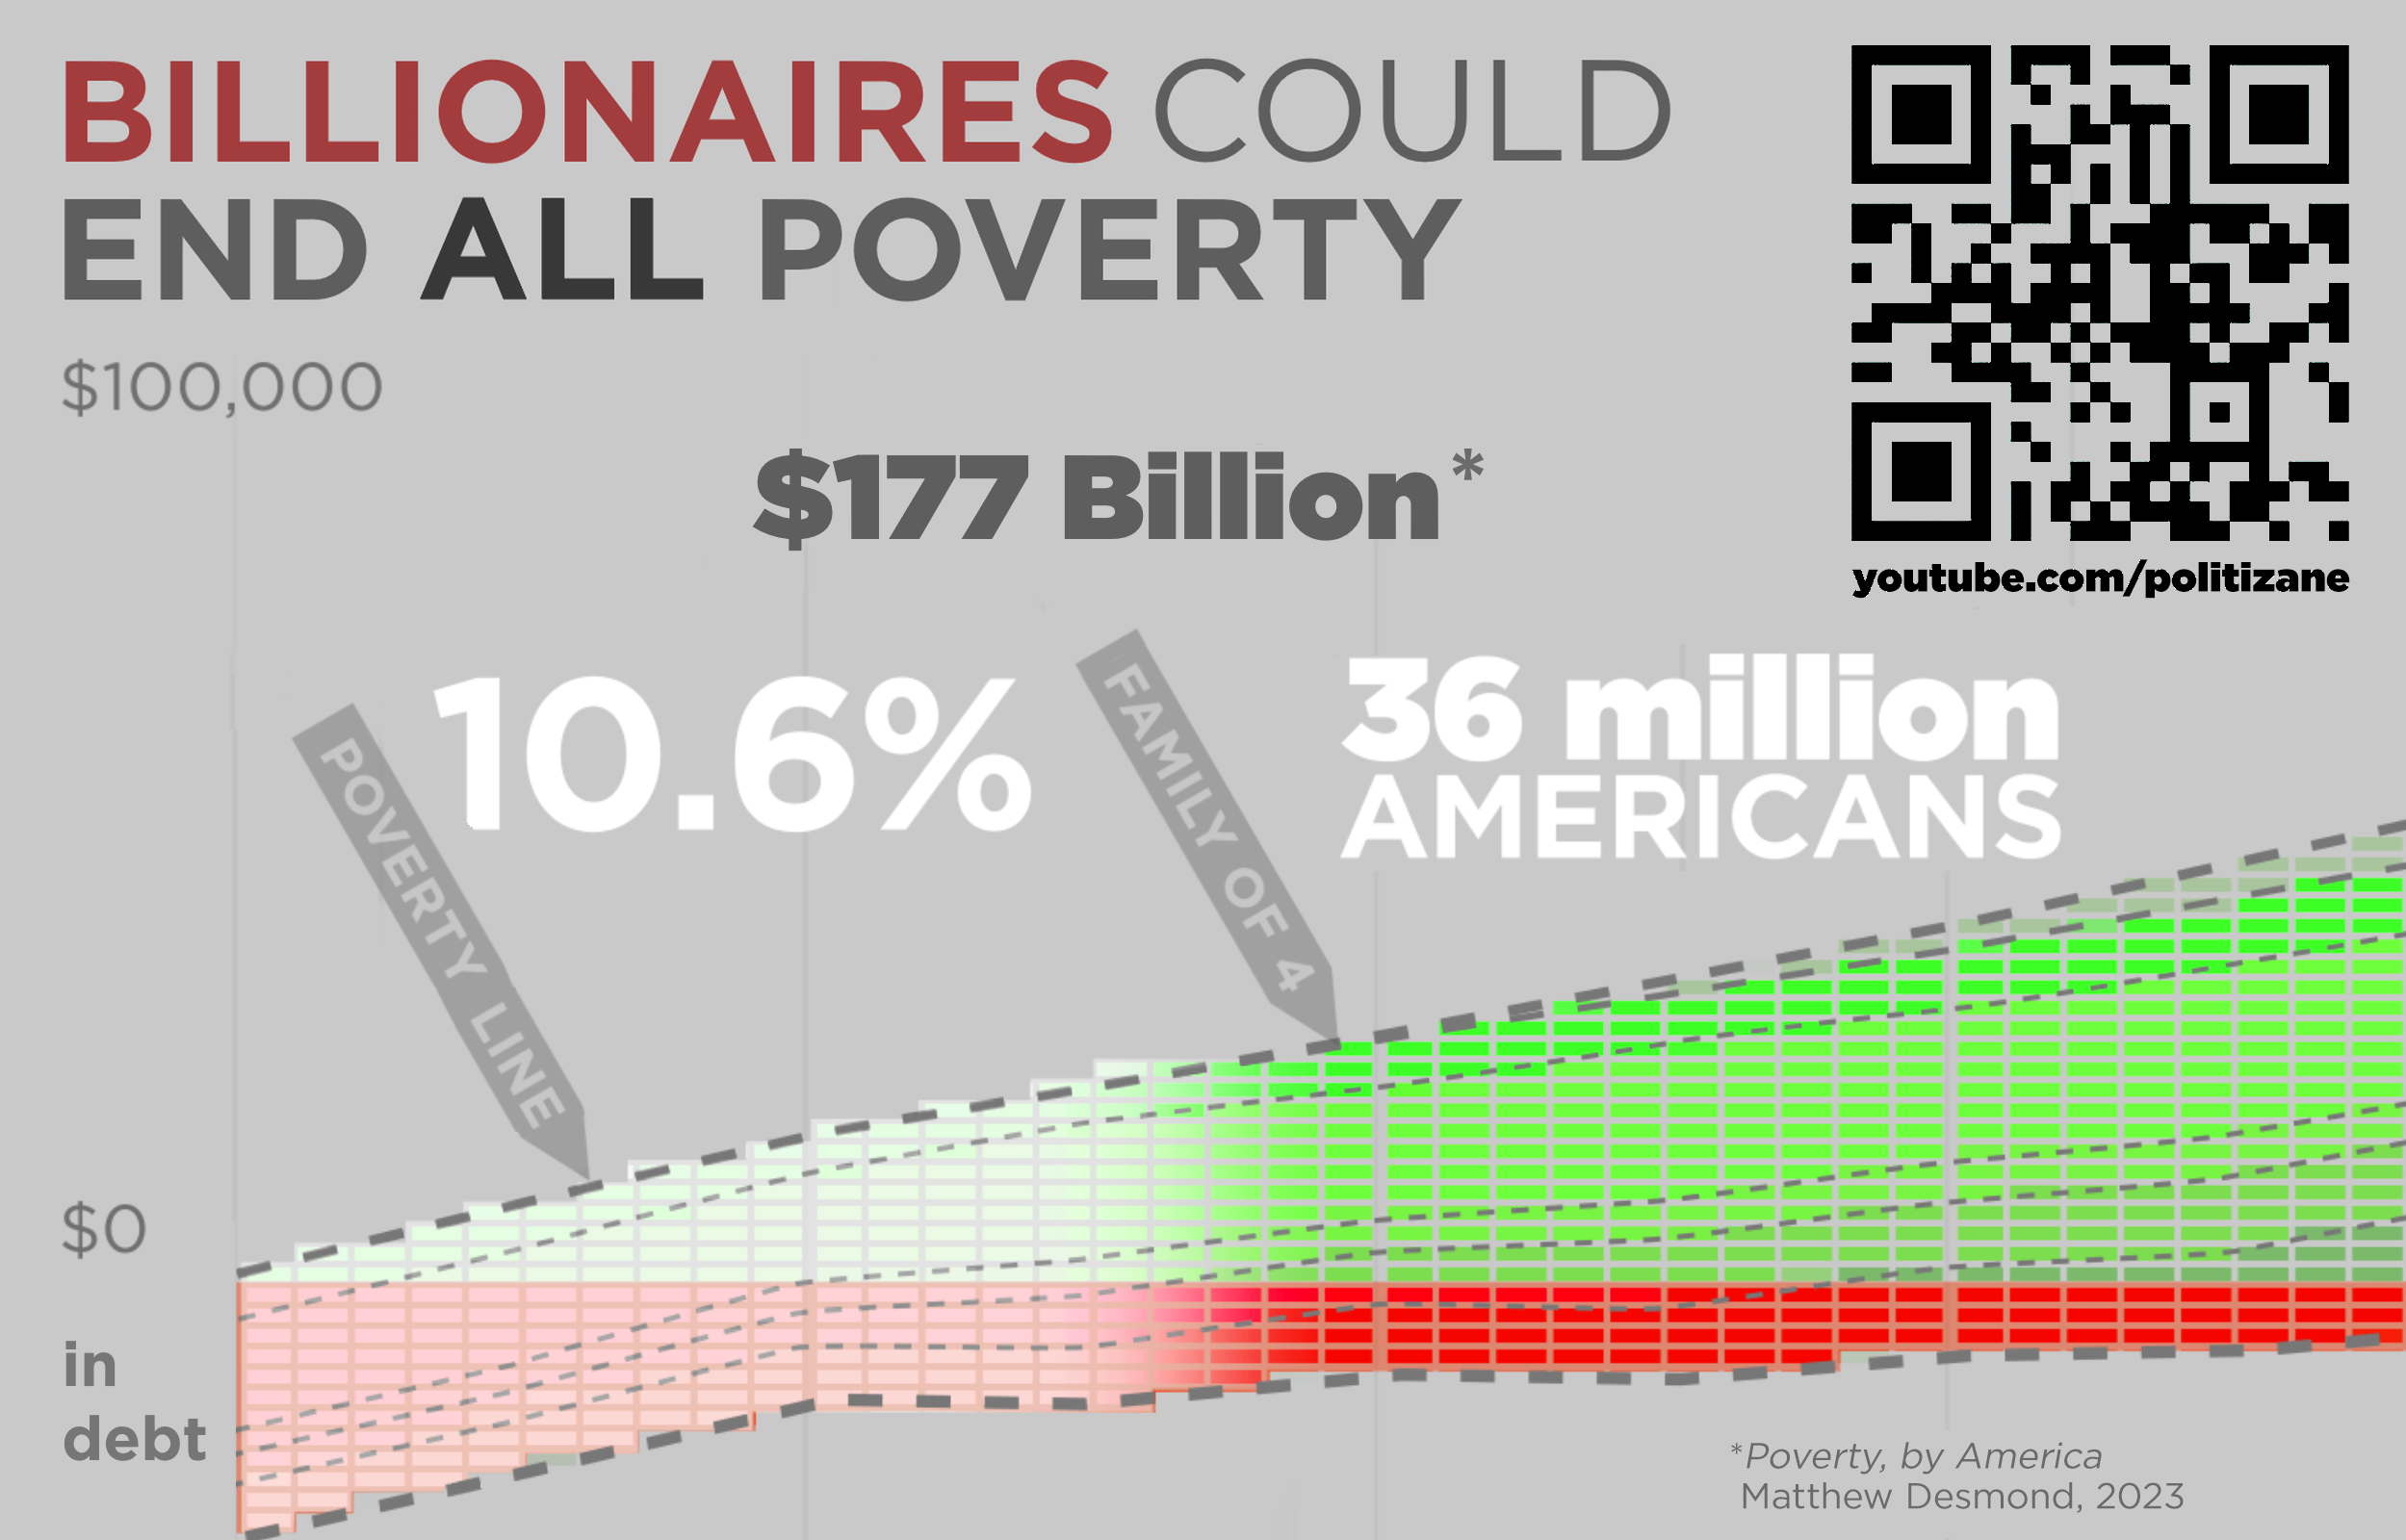
But we, for some reason, choose not to. We choose to let people suffer in desperate poverty. That's also suffering as a feature. In an era of unprecedented wealth, why shouldn't that money be out there doing something, somewhere, for someone?
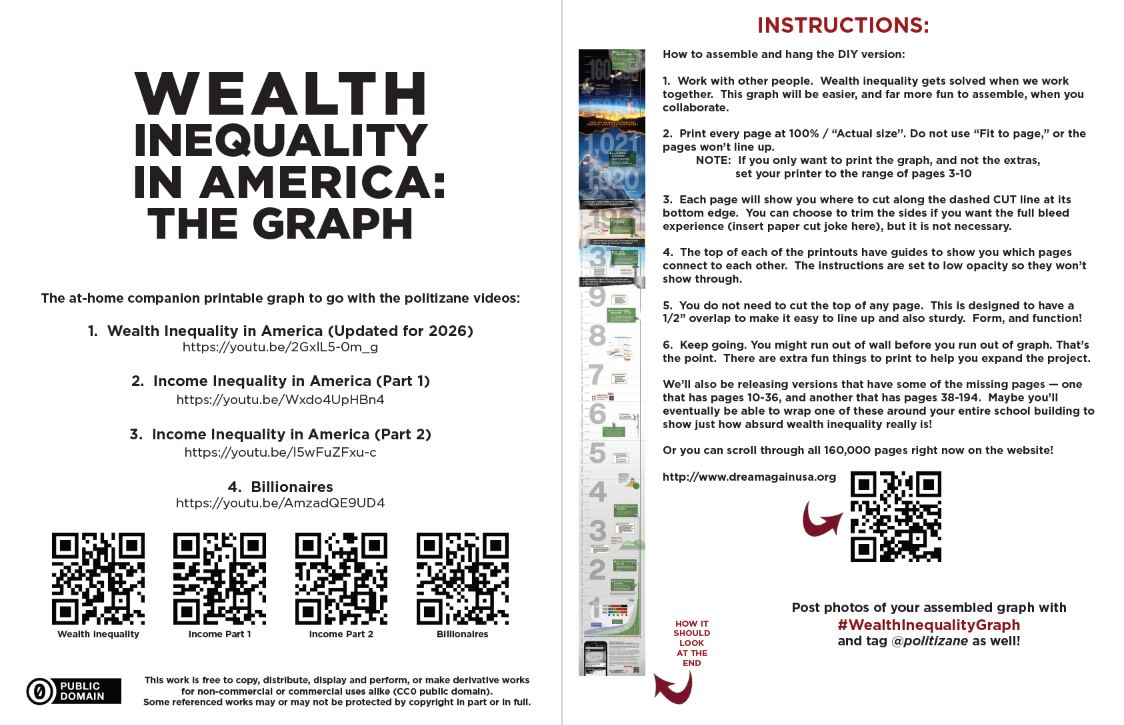
I've spent my whole career talking about software usability, and I never thought I would design software that chooses to actively punish the user, but the data itself is the pain. Representing the massive numbers of wealth inequality with a linear scale is the only honest way to present this data. Do you have any idea how many pages it would take to print this graph in its entirety, representing both the richest American at the top, and the poorest American at the bottom?
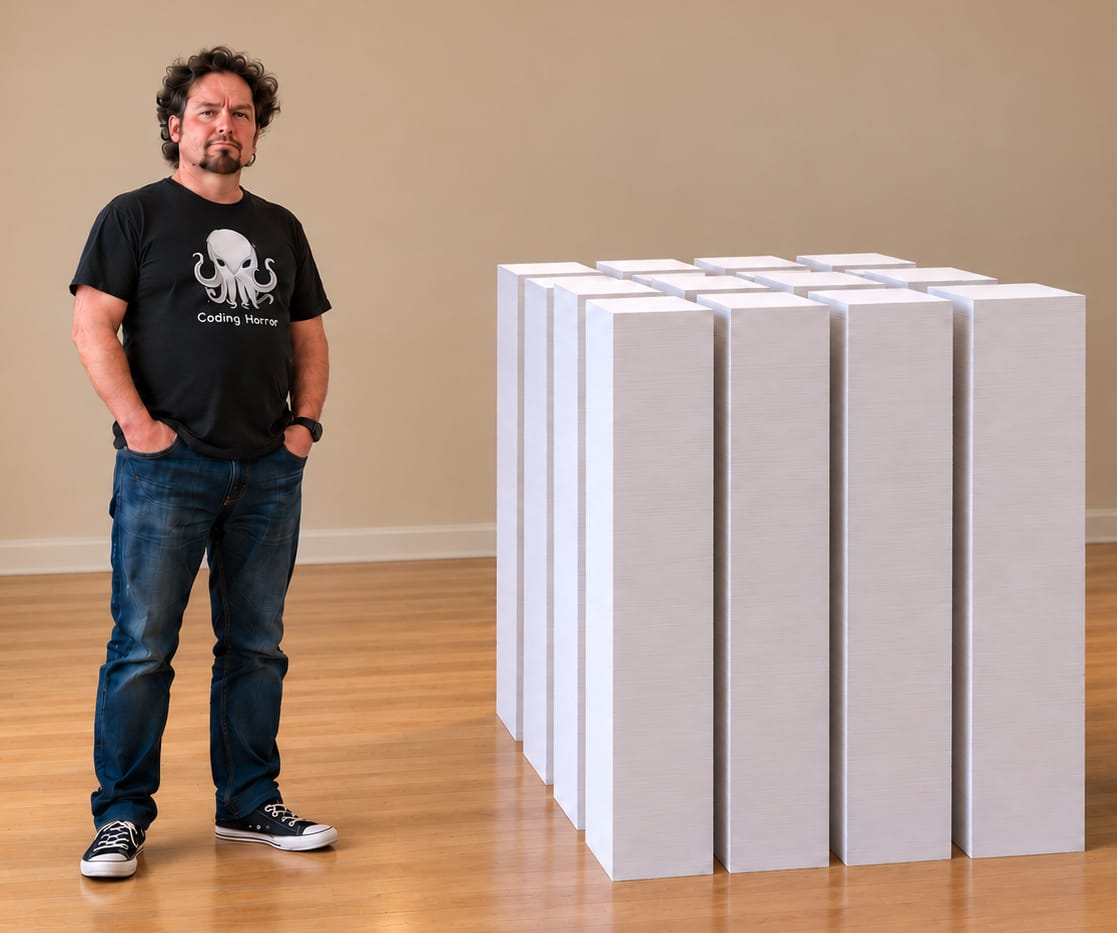
What you should print out is this is 8 page foldable version of the graph, designed to be a relatable 6 feet, 6 inches, the average NBA player height. Show everyone what the most obscene centerfold of all time looks like. Let them see.
I challenge everyone to climb the graph on dreamagainusa.org as far as you want to.
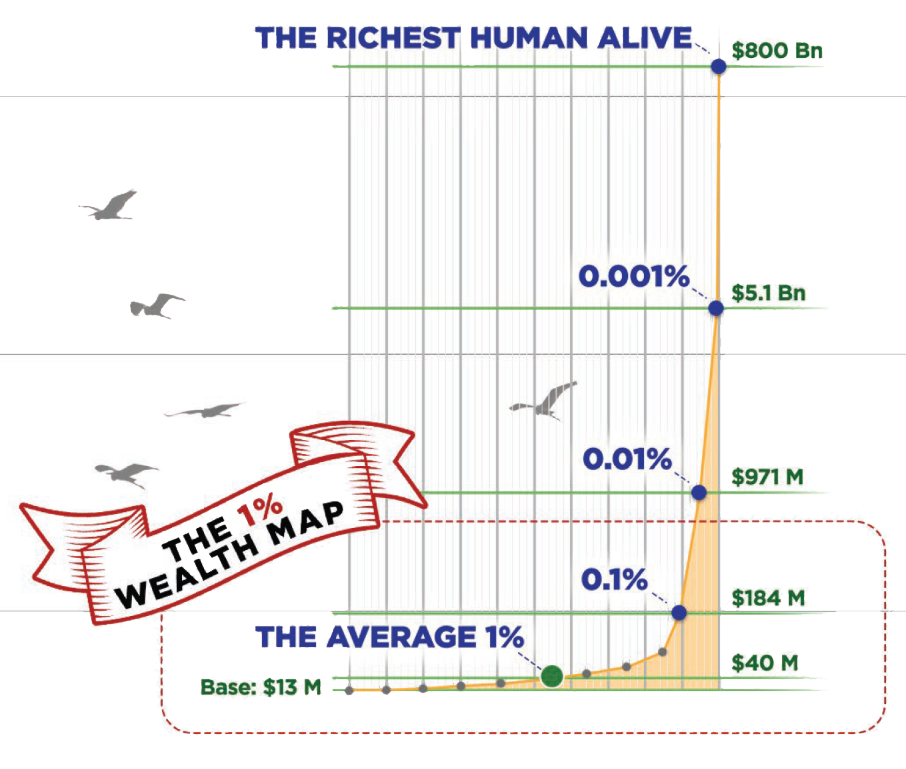
If you do reach the so-called "top", I have a question.
Was it worth it?