Coding Horror

programming and human factors

A Comparison of JPEG Compression Levels and Recompression

Over the years, I've standardized on a JPEG compression factor of 15; I find that generally provides the best compromise between image quality and file size for most photographic images.

Although I've done some ad-hoc testing that pointed to compression factor 15 as the sweet spot before, I've never done a formal test. So I performed a JPEG compression series using the Lena reference image*. Note that I resized the image slightly (from 512x512 to 384x384) to keep the file sizes relatively small. The original, uncompressed image size is 433 kilobytes.

compression factor 10 (39 kb) compression factor 15 (30 kb)
Lena image, compression factor 10 Lena image, compression factor 15
compression factor 20 (26 KB) compression factor 30 (16 KB)
Lena image, compression factor 20 Lena image, compression factor 30
compression factor 40 (11 KB) compression factor 50 (9 KB)
Lena image, compression factor 40 Lena image, compression factor 50

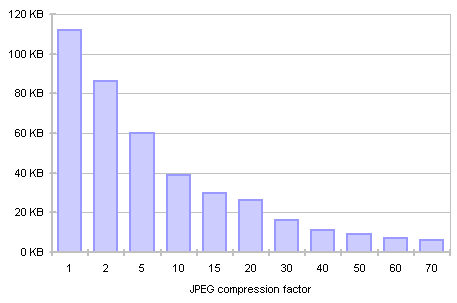
Beyond 50 percent compression factor, quality falls off a cliff, so I won't bother displaying anything higher. Here's a more complete breakdown of JPEG compression factor and file size for the 384x384 Lena image:

JPEG Compression Level vs. File Size graph

I was also curious what the image quality and file size penalty was for recompressing a JPEG image. That is, opening a JPEG and re-saving it as a JPEG, including all the artifacts from the original compressed image in the recompression. I've been forced to do this when I couldn't find an uncompressed or high quality version of the image I needed, and I always wondered how much worse it made the image when I recompressed it.

For the recompression test, I started with the uncompressed, resized 384x384 Lena reference image. For each new generation, I opened and saved the previous generation with my standard JPEG compression factor of 15.

Generation 1 (30kb) Generation 2 (30kb)
Lena image, generation 1 Lena image, generation 2
Generation 3 (30kb) Generation 4 (30kb)
Lena image, generation 3 Lena image, generation 4
Generation 5 (30kb) Generation 10 (30kb)
Lena image, generation 5 Lena image, generation 10

I was quite surprised to find that there's very little visual penalty for recompressing a JPEG once, twice, or even three times. By generation five, you can see a few artifacts emerge in the image, and by generation ten, you're definitely in trouble. There's virtually no effect at all on file size, which stays constant at 30-31 kilobytes even through generation 15.

* An entire set of classic reference images is available from the USC-SIPI image database. I distinctly remember that Mandrill image from my Amiga days.

Discussion

How Good an Estimator are You? Part III

For the final installment in the How Good an Estimator Are You series, I'd like to start with an anecdote from chapter 7 of Software Estimation: Demystifying the Black Art :

Suppose you're at a reception for the world's best software estimators. The room is packed, and you're seated in the middle of the room at a table with three other estimators. All you can see as you scan the room are wall-to-wall estimators. Suddenly, the emcee steps up to the microphone and say "We need to know exactly how many people are in the room so we can order dessert. Who can give the most accurate estimate for the number of people in the room?"

Bill, the estimator to your right, says "I make a hobby of estimating crowds. Based on my experience, it looks to me like we've got about 335 people in the room."

The estimator sitting across the table from you, Karl, says, "This room has 11 tables across and 7 tables deep. One of my friends is a banquet planner, and she told me that they plan for 5 people per table. It looks to me like most of the tables do actually have about 5 people at them. If we multiply 11 times 7 times 5, we get 385 people. I think we should use that as our estimate."

The estimator on your left, Lucy, says, "I noticed on the way into the room that there was an occupancy limit sign that says this room can hold 485 people. This room is pretty full. I'd say 70 to 80 percent full. If we multiply those percentages by the room limit, we get 340 to 388 people. How about if we use the average of 364 people, or maybe just simplify it to 365?"

Bill says, "We have estimates of 335, 365, and 385. It seems like the right answer must be in there somewhere. I'm comfortable with 365."

Everyone looks at you. You say, "I need to check something. Would you excuse me for a minute?"

You return a few minutes later. "Remember how we had to have our tickets scanned before we entered the room? I noticed on my way into the room that the handheld ticket scanner had a counter. So I went back and talked to the ticket taker at the front door. She said that, according to her scanner, she has scanned 407 tickets. She also said no one has left the room so far. I think we should use 407 as our estimate. What do you say?"

The moral of this story, of course, is that you should avoid estimating what you can count. And if you can't get a count, you should at least try to compute the estimate from a related count, like Karl did in the anecdote above. The absolute worst estimates you can produce are judgmental-- estimates that are not derived from an actual count of any kind.

The real art of software estimation, then, is the frantic search for data points to hang your estimates on. Hopefully you're fortunate enough to work for an organization that captures historical data for your projects.

What kind of stuff can you count on a software project? Lots of stuff, actually:

  • Marketing requirements
  • Features
  • Use cases
  • Stories
  • Engineering requirements
  • Function points
  • Change requests
  • Web pages
  • Reports
  • Dialog boxes
  • Database tables (or procs, views, etc)
  • Classes
  • Defects found
  • Configuration settings
  • Lines of code
  • Test cases
  • Code churn

One reason I'm working so closesly with Team System these days is that it makes capturing some of these metrics (almost) effortless.

The art of building an estimate from known reference points isn't a new topic in computer science. One of my favorite chapters in Programming Pearls is about how essential back of the envelope calculations are to software development:

It was in the middle of a fascinating conversation on software engineering that Bob Martin asked me, "How much water flows out of the Mississippi River in a day?" Because I had found his comments up to that point deeply insightful, I politely stifled my true response and said, "Pardon me?" When he asked again I realized that I had no choice but to humor the poor fellow, who had obviously cracked under the pressures of running a large software shop.

My response went something like this. I figured that near its mouth the river was about a mile wide and maybe twenty feet deep (or about one two-hundred-and-fiftieth of a mile). I guessed that the rate of flow was five miles an hour, or a hundred and twenty miles per day. Multiplying

1 mile x 1/250 mile x 120 miles/day ~ 1/2 mile3/day

showed that the river discharged about half a cubic mile of water per day, to within an order of magnitude. But so what?

At that point Martin picked up from his desk a proposal for the communication system that his organization was building for the Summer Olympic games, and went through a similar sequence of calculations. He estimated one key parameter as we spoke by measuring the time required to send himself a one-character piece of mail. The rest of his numbers were straight from the proposal and therefore quite precise. His calculations were just as simple as those about the Mississippi River and much more revealing. They showed that, under generous assumptions, the proposed system could work only if there were at least a hundred and twenty seconds in each minute. He had sent the design back to the drawing board the previous day. (The conversation took place about a year before the event, and the final system was used during the Olympics without a hitch.)

That was Bob Martin's wonderful (if eccentric) way of introducing the engineering technique of "back-of-the-envelope" calculations. The idea is standard fare in engineering schools and is bread and butter for most practicing engineers. Unfortunately, it is too often neglected in computing.

Steve Bush, in a recent comment, pointed out that physicist Enrico Fermi was famed for these kinds of calculations, and apparently Fermi coined the phrase "back-of-the-envelope calculation".

These calculations are typically represented in the form of Fermi Questions; the canonical Fermi Question is How many piano tuners are there in Chicago?

  • From the almanac, we know that Chicago has a population of about 3 million people.
  • Assume that an average family contains four members. The number of families in Chicago is about 750,000.
  • If one in five families owns a piano, there will be 150,000 pianos in Chicago.
  • If the average piano tuner serviced four pianos every day of the week for five days, rested on weekends, and had a two week vacation during the summer, then in one year (52 weeks) he would service 1,000 pianos.
  • 150,000 / (4 x 5 x 50) = 150
  • there are ~150 piano tuners in Chicago

Fermi questions are interesting, because the actual answer to the question is secondary to the process of how you arrived at the answer. Did you guess? Or did you estimate?

Discussion

The Monopoly Interview

Reginald Braithwaite's favorite interview question is an offbeat one: sketch out a software design to referee the game Monopoly.*

I think it's a valid design exercise which neatly skirts the puzzle question trap. But more importantly, it's fun.

Interviews are a terror for the interviewee. And they're stressful for the interviewer, too. A design excercise centered around a salt-of-the-earth game like Monopoly is a great way to put both parties at ease. Lots of people have played Monopoly at some point, so you have a nice, common base of familiarity to work with.

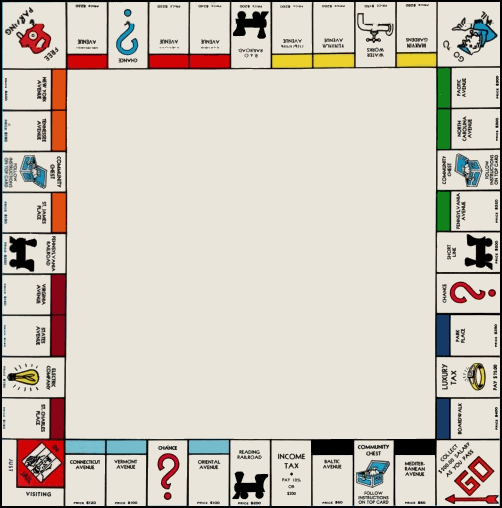
The (classic) Monopoly board

Anything is better than the "how would you write a routine to copy a file" interview question, but any company that asks an entertaining and useful interview question like this is already a winner in my book.

But what I love most about the Monopoly question is how it sucks me in. Maybe it's because I'm a gamer at heart, but my mind immediately starts racing through all the different possibilities. It's a little embarrassing to admit, but I'd love nothing more than to sit in a room with another programmer and hash this problem out.

Because it's fun.

And isn't programming supposed to be fun?

* Monopoly is in the process of permanently updating their game board. Was anyone really complaining that Monopoly wasn't grounded in modern locations and current property valuations? I hope this doesn't devolve into another "New Coke" fiasco. At least the classic edition of the game will still be available.

Discussion

How Good an Estimator Are You? Part II

Here are the answers to the quiz presented in How Good an Estimator Are You?

If you're concerned that a quiz like this has nothing to do with software development, consider:

In software, you aren't often asked to estimate the volume of the Great Lakes or the surface temperature of the sun. Is it reasonable to expect you to be able to estimate the amount of U.S. currency in circulation or the number of books published in the U.S., especially if you're not in the U.S.?

Software developers are often asked to estimate projects in unfamiliar business areas, projects that will be implemented in new technologies, the impacts of new programming tools on productivity, the productivity of unidentified personnel, and so on. Estimating in the face of uncertainty is business as usual for software estimators. The rest of [the book Software Estimation: Demystifying the Black Art] explains how to succeed in such circumstances.

If you haven't read the entry with the quiz questions, please read it now before reading any further, so you'll have an opportunity to try it before seeing the answers.

Question Answer
Surface temperature of the sun 10,000F / 6,000C
Latitude of Shanghai 31 degrees North
Area of the Asian continent 17,139,000 square miles
44,390,000 square kilometers
The year of Alexander the Great's birth 356 BC
Total value of U.S. currency in circulation in 2004 $719.9 billion
Total volume of the Great Lakes 5,500 cubic miles
23,000 cubic kilometers
2.4 x 10^22 cubic feet
6.8 x 10^20 cubic meters
1.8 x 10^23 U.S. gallons
6.8 x 10^23 liters
Worldwide box office receipts for the movie Titanic $1.835 billion
Total length of the coastline of the Pacific Ocean 84,300 miles
135,663 kilometers
Number of book titles published in the U.S. since 1776 22 million
Heaviest blue whale ever recorded 380,000 pounds
190 English tons
170,000 kilograms
170 metric tons

The specific goal of the exercise was to estimate at the 90 percent confidence level. There are 10 questions in the quiz, so if you were truly estimating at a 90 percent confidence level, you would have gotten about 9 answers correct.

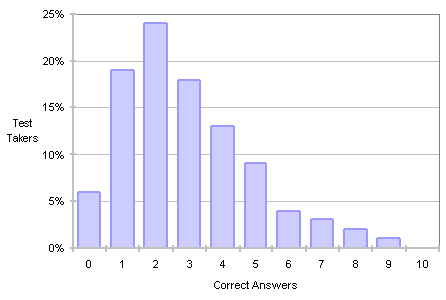
McConnell gives this quiz to every participant in his estimation course. The results are pictured in the chart below.

Estimation quiz results chart

He offers this analysis of the data:

For the test takers whose results are shown in the figure, the average number of correct answers is 2.8. Only 2 percent of quiz takers score 8 or more correct answers. No one has ever gotten 10 correct. I've concluded that most people's intuitive sense of "90% confident" is really comparable to something closer to "30% confident." Other studies have confirmed this basic finding (Zultner 1999, Jrgensen 2002).

Additionally, the few people who manage to get close to the goal of ~9 correct answers typically feel they did something wrong:

When I find the rare person who gets 7 or 8 answers correct, I ask "How did you get that many correct?" The typical response? "I made my ranges too wide."

My response is, "No, you didn't! You didn't make your ranges wide enough!" If you get only 7 or 8 correct, your ranges were still too narrow to include the correct answer as often as you should have.

We are conditioned to believe that estimates expressed as narrow ranges are more accurate than estimates expressed as wider ranges. We believe that wide ranges make us appear ignorant or incompetent. The opposite is usually the case.

So, what have we learned from this exercise?

  • When you ask someone for a range that provides 90% confidence, expect 30% confidence on average.
  • People are naturally hesitant to provide wide ranges – even when the confidence level requires a wide range to be accurate – because they feel that narrow estimates are a sign of a better estimate.

Narrow estimates are self-defeating, but unfortunately they are human nature. Unless you have specific data that supports your narrow estimate, your estimate probably should be wider than you made it.

Discussion

How Good an Estimator Are You?

Chapter 2 of Software Estimation: Demystifying the Black Art opens with a quiz designed to test your estimation abilities. It's an interesting exercise, so I thought everyone might like to give it a shot.

  • For each question, fill in the upper and lower bounds so that you have a 90 percent chance of including the correct value.
  • Don't make your ranges too narrow or too wide, but be sure they're wide enough to give you a 90 percent chance of hitting the correct value.
  • Don't research the answers on the internet.
  • You must provide an estimate range for each question.
  • Spend no more than 10 minutes on this quiz.

So, how good an estimator are you?

Question Low Estimate High Estimate
Surface temperature of the sun  
Latitude of Shanghai  
Area of the Asian continent  
The year of Alexander the Great's birth  
Total value of U.S. currency in circulation in 2004  
Total volume of the Great Lakes  
Worldwide box office receipts for the movie Titanic  
Total length of the coastline of the Pacific Ocean  
Number of book titles published in the U.S. since 1776  
Heaviest blue whale ever recorded  

Remember, the purpose of the quiz isn't to determine whether or not you're the next Ken Jennings. It's about estimation, not trivia.

Tomorrow, I'll print the answers along with a deeper explanation of this exercise.

Discussion